Blog | Paper Assets
America, Do You Feel $17 Trillion Richer?
July 01, 2015
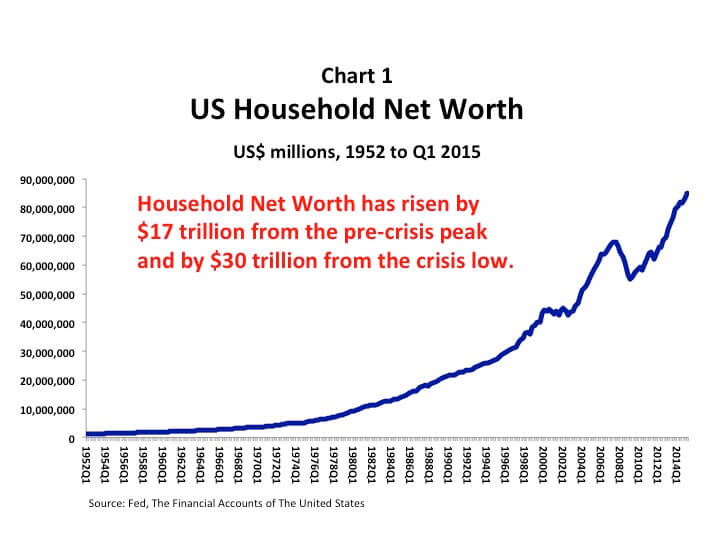
Well, thanks to Quantitative Easing and six years of zero percent interest rates, you are. According to The Financial Accounts Of The United States (published by the Fed), American households are $17 trillion richer now than they were in the third quarter of 2007, at the peak of the credit bubble just before it collapsed. That is 25% richer. And that’s from the pre-crisis peak. From the lowest point of the crisis, household sector net worth is up by $30 trillion, or by a mind-blowing 55%.

Here are the details. From the pre-crisis peak to the first quarter of 2015, the assets of the household sector rose by $17 trillion (21%). The largest increases in asset values occurred in pension entitlements, which rose by $5.7 trillion (37%), mutual fund share holdings, which rose by 3.3 trillion (70%) and equity holdings, which increased by $3 trillion (28%). Bank deposits and currency holdings also increased by $3 trillion (41%). Interestingly, the value of owner-occupied real estate is still $164 billion less now than it was at the peak.
While household assets have soared in value, household liabilities have remained flat. In fact, they have contracted by $37 billion from Q3 2007. The composition of the liabilities has changed, however. Households have paid down (and/or defaulted on) $1.1 trillion of mortgage debt, reducing the amount owed on mortgages by 11%. But, they have increased their borrowing through consumer credit by $760 billion (30%) and by other bank loans by $214 billion (more than 1,000%).
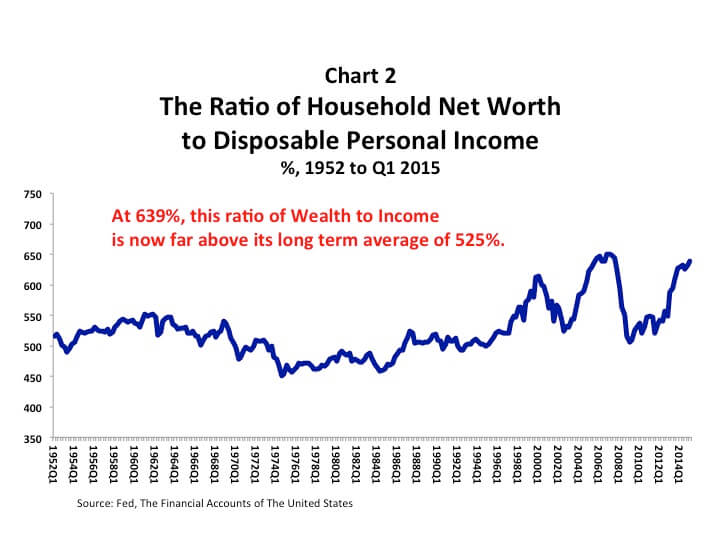
Disposable personal income has also risen since Q3 2007 - by $2.7 trillion (26%). While that is quite an impressive jump, the increase in income has lagged way behind the increase in net worth. In fact, as you can see in the following chart, the ratio of net worth to disposable personal income has become very stretched relative to its average level during the past 60 years.

This ratio, which can be thought of as the ratio of wealth to income, is nearly as high now (639%) as it was at the peak of the credit bubble in 2007 (650%). And it is considerably higher than it was at the peak of the Nasdaq bubble in 2000 (615%). Between 1952 and now, the average for this ratio has been 525%.
This stretched ratio of wealth to income is a cause for concern. It suggests that asset prices could be significantly overvalued, as they were in 2000 and 2007. Asset values can only rise so high relative to income before they become unaffordable.
The current record low level of interest rates has pushed asset prices higher by making the cost of financing them through debt much lower. Interest rates, however, may soon begin to rise. The Fed has led financial market participants to believe that it may begin to increase the Federal Funds rate as soon as September. If it does, it could provoke a significant selloff in the stock market. That would reduce household sector net worth by reducing the value of stocks, mutual fund shares and pension fund entitlements. Higher interest rates would also most probably cause the value of real estate holdings to fall, as the cost of mortgage funding rose.
Investors should not ignore the risks that the threat of higher interest rates poses to their wealth. Asset values are stretched. The risks are high. This is the time for caution.
My video-newsletter, Macro Watch, now offers more than 16 hours of video content covering all aspects of the global economic crisis, including how investors are likely to be impacted during the months and years ahead.
If you are not yet a Macro Watch member, join here:
http://www.richardduncaneconomics.com/product/macro-watch/
For a 50% subscription discount, hit the “Sign Up Now” tab and, when prompted, use the coupon code: richdad
A new Macro Watch video will be added approximately every two weeks.
Original publish date:
July 01, 2015