Blog | Paper Assets
The Rich Dad Beginner’s Guide to Candlestick Chart Patterns
Understanding the story candlestick patterns tell, and how to use them in to inform your investing strategy
Rich Dad Paper Assets Team
September 06, 2023
Summary
-
Candlestick charts provide key information about the price range of a stock within a specific timeframe, including the open price, closing price, lowest price, and highest price
-
Different elements of a candlestick chart include the real body, which represents the space between the opening and closing prices, and shadows, which represent the high and low prices for the day
-
Candlestick patterns can indicate potential market trends and reversals, such as doji, hanging man, hammer, bullish engulfing, shooting star, inverted hammer, marubozu, dark cloud cover, piercing, bearish harami, and bullish harami patterns
A while back, we gave a basic primer on charts in technical investing. Today, we’re going to dive a little deeper into one type of chart that can be a powerful tool in your paper investing box—the candlestick chart.
What is a candlestick chart?
As we wrote in our post on charts in technical investing, the candlestick chart is perhaps the most popular among traders. If you haven’t seen one before, here’s what a candlestick chart looks like:
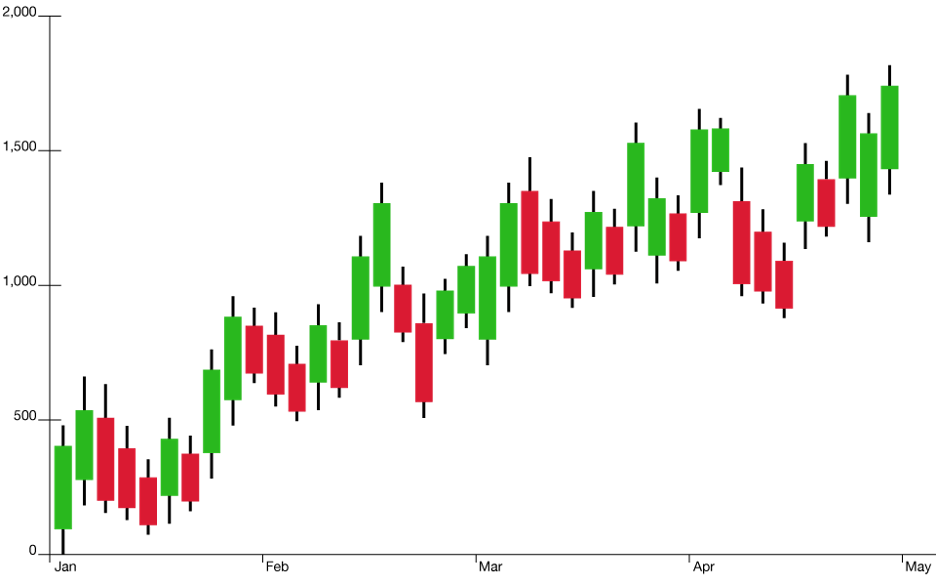
In a nut shell, candlestick charts tell us the price of a stock in a certain frame of time.
They provide four key pieces of information:
- The open price
- The closing price
- The lowest price
- and the highest price
The middle part of the candlestick is called the real body, and it represents the space between the opening and closing price of the stock. If it’s green, it means the price went up that day. If it’s read, it meant it went down.


The area above and below the real body are called shadows, and they represent the high and low price for the day. Below is an example to visually illustrate.
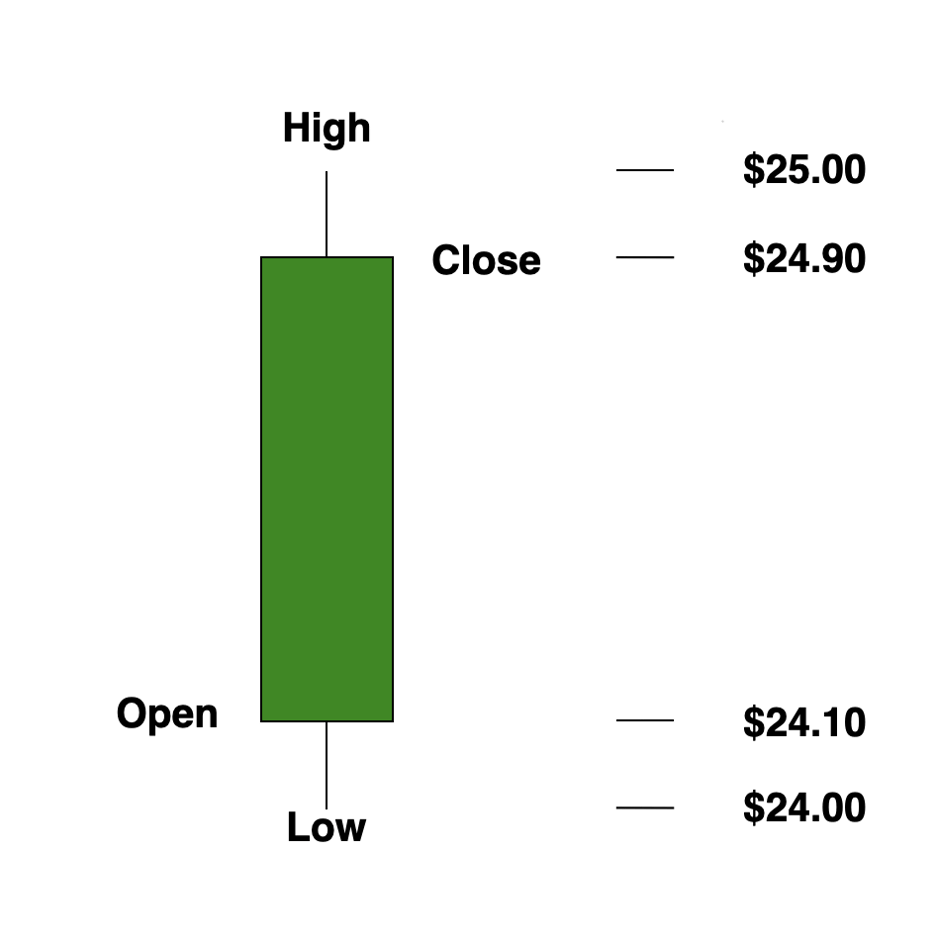
In this example, the real body is green, so the stock went up that day. It opened at $24.10, and it closed at $24.90. It’s lowest price was $24.00, and it’s highest price was $25.00.
Why candlestick charts are important
Candlestick charts are important tools in technical analysis because they help you understand the price action of a stock. By analyzing the patterns formed by the candlesticks, traders and investors can make informed decisions about when to buy or sell a stock.
As a paper asset trader, you can pay attention to different candlestick patterns that can indicate potential market trends and reversals. For example, a doji candlestick, which has a small real body and equal or almost equal shadows, suggests indecision in the market. A bullish engulfing pattern occurs when a small red candlestick is followed by a larger green candlestick, indicating a potential reversal from a downtrend to an uptrend.
By studying candlestick charts and recognizing these patterns, traders can gain insights into market sentiment and make more informed trading decisions. It is important to remember that candlestick patterns are not guarantees, but they can provide valuable alerts for potential changes in market direction.
Different patterns in candlestick charts
There are a number of different patterns that are important to know in when it comes to reading candlestick charts. Each is an important indicator for what the market is doing and are valuable for helping you form your investment strategy.
That being said, candlestick patterns are not guarantees. They only serve as alerts for potential changes in market direction. It is recommended to practice identifying candle patterns and their significance using paper trading accounts and educational resources.
In this post, we’ll cover some of the basic patterns to give you a good foundation for further research and practice.
Hangman
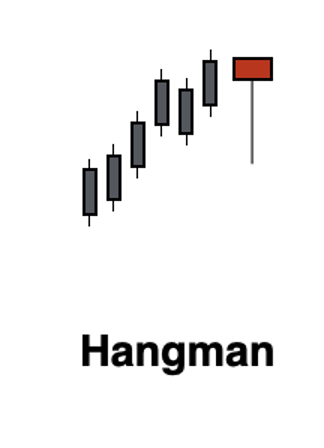
The hangman is a pattern that can indicate a potential change in the stock market. It occurs when the price of a stock has been going up but then starts to lose momentum. The hangman pattern is characterized by a small body and a long shadow below, with little or no shadow above. This pattern suggests that the buyers were initially in control but now the sellers might take over.
Hammer
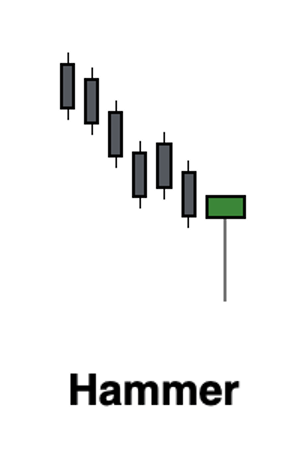
The hammer candlestick pattern is a bullish signal that appears at the end of a downtrend. It has a small body and a long lower shadow, with little to no upper shadow. This pattern suggests that the sellers were losing control, and the buyers might start to take over.
Doji
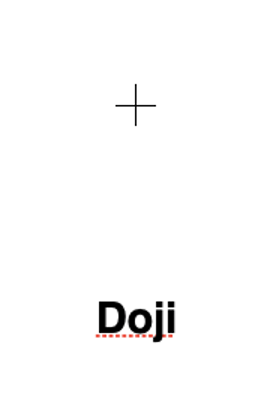
The doji candlestick pattern is a special pattern that shows indecision in the market. It looks like a cross or a plus sign. It means that buyers and sellers are not sure which way the price will go. The doji pattern has a small body or no body at all, with equal top and bottom lines.
Shooting Star
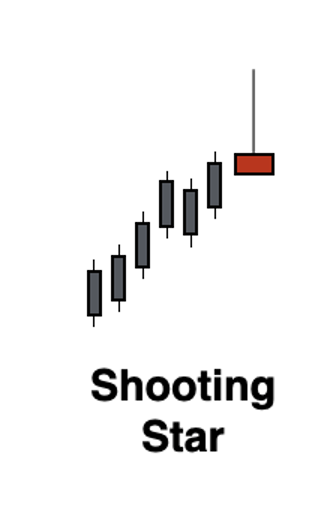
The shooting star candlestick pattern is a signal that the price of a stock or asset might reverse from an uptrend to a downtrend. It looks like a star with a small body and a long shadow on top, and it suggests that the buyers were initially in control but lost their power, giving the advantage to the sellers.
Inverted Hammer
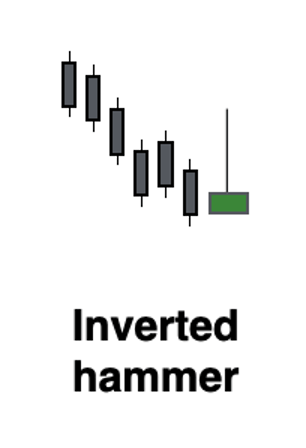
The inverted hammer candlestick pattern is a special shape that appears when a stock is going down. It has a small body and a long shadow on top, with no or very little shadow at the bottom. This pattern suggests that the sellers were in control at first, but then the buyers might start taking control.
Marubozu
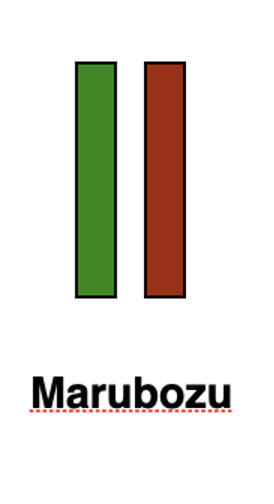
The marubozu candlestick pattern is a strong continuation pattern that doesn't have any shadows. It can be either bullish or bearish, depending on whether the real body is green or red. A bullish marubozu has a long green body, showing that buyers are in control and the price is going up. On the other hand, a bearish marubozu has a long red body, indicating that sellers are dominating and the price is falling.
Bullish Engulfing
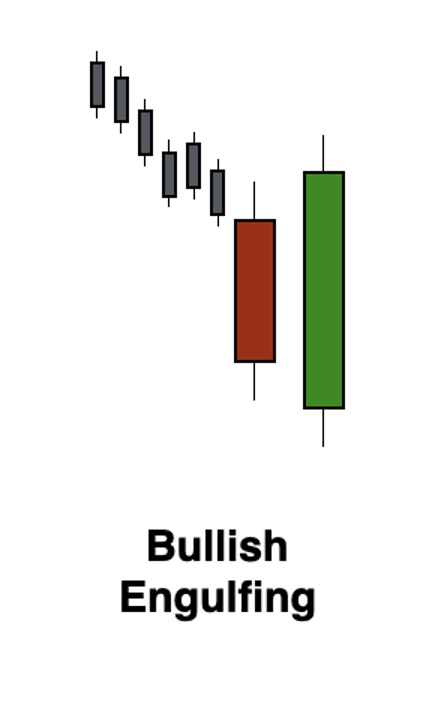
The bullish engulfing candlestick pattern is a pattern that indicates a possible change in the direction of a stock's price. It occurs after a period of falling prices. The pattern consists of two candles: a small candlestick that shows a decrease in price, followed by a larger candlestick that completely covers or "engulfs" the previous candlestick. This pattern suggests that buyers are starting to take control and that the price may start to rise.
Bearish Engulfing
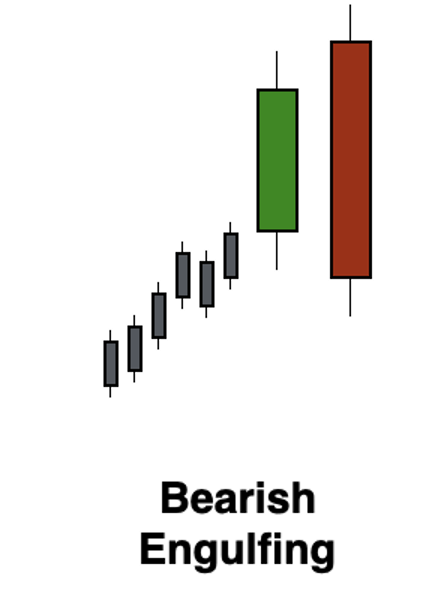
The bearish engulfing candlestick pattern is a pattern that signals a potential reversal in the stock's price after it has been going up. It consists of two candles: a small candle that goes up, followed by a larger candle that goes down and completely covers the previous candle. This pattern suggests that the sellers have taken control and that the previous upward movement in the stock's price may be coming to an end.
Dark Cloud Cover
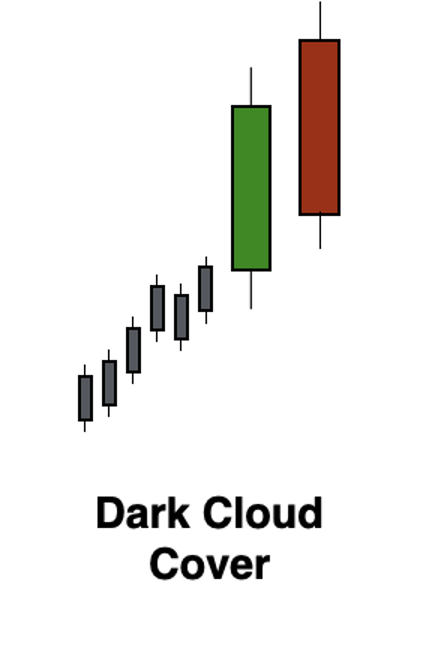
The dark cloud cover candlestick pattern is a bearish pattern that occurs after a stock has been going up. It consists of a candle that goes up and a candle that goes down. The candle that goes down opens above the high point of the previous candle and closes below the middle of the previous candle. This pattern suggests that the sellers are getting stronger and that the previous upward trend may be reversing.
Piercing
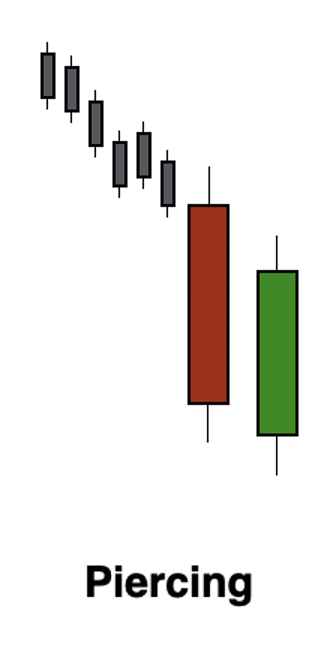
The piercing candlestick pattern is a special pattern that can indicate a change in the stock market. It happens after a period when stock prices were going down. The pattern consists of two candles. The first candle shows that prices were going down, while the second candle shows that prices started going up. The second candle opens below the lowest point of the first candle but closes above the middle of the first candle. This pattern suggests that the people who want to buy stocks are becoming stronger, and the downward trend may be changing.
Bearish Harami
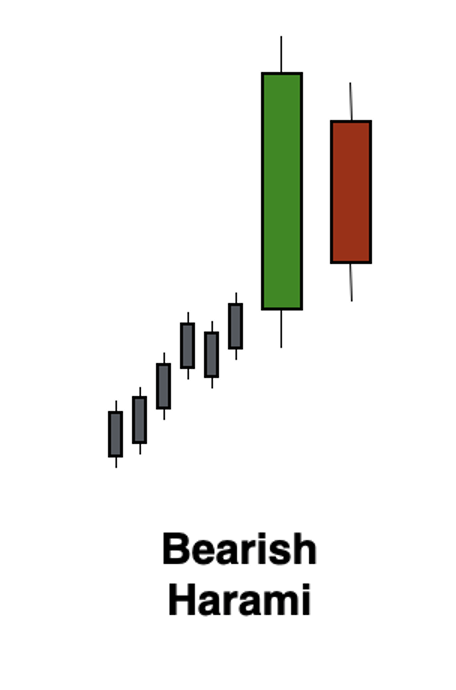
The bearish harami candlestick pattern is a signal that the price of a stock might start going down after going up for a while. It happens when there is a big green candle followed by a small red candle that fits inside the green candle. This pattern suggests that the buyers are losing power and the sellers might take control.
Bullish Harami
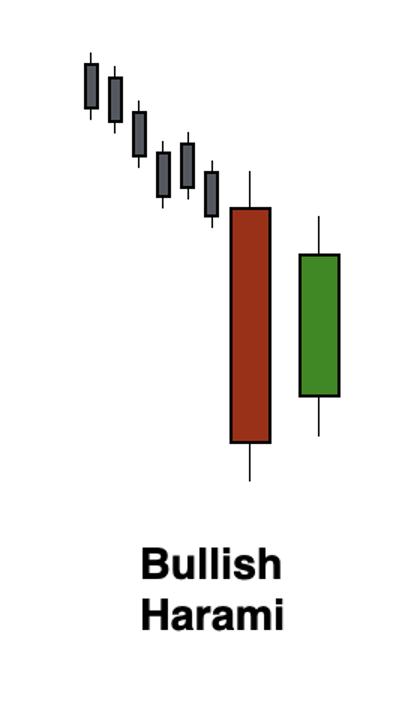
The bullish harami is a candlestick pattern that indicates a possible change in the market direction. It occurs after a downtrend and consists of a big red candle followed by a small green candle that fits inside the previous candle. This pattern suggests that selling pressure is weakening and that the market may start to move upwards.
Candlestick charts can tell an important story over time
In his excellent course on paper asset investing, The Four Pillars of Investing , Andy Tanner uses the humorous story of how every love story on Seinfeld is the same in order to illustrate the story that candlestick charts can tell over time.
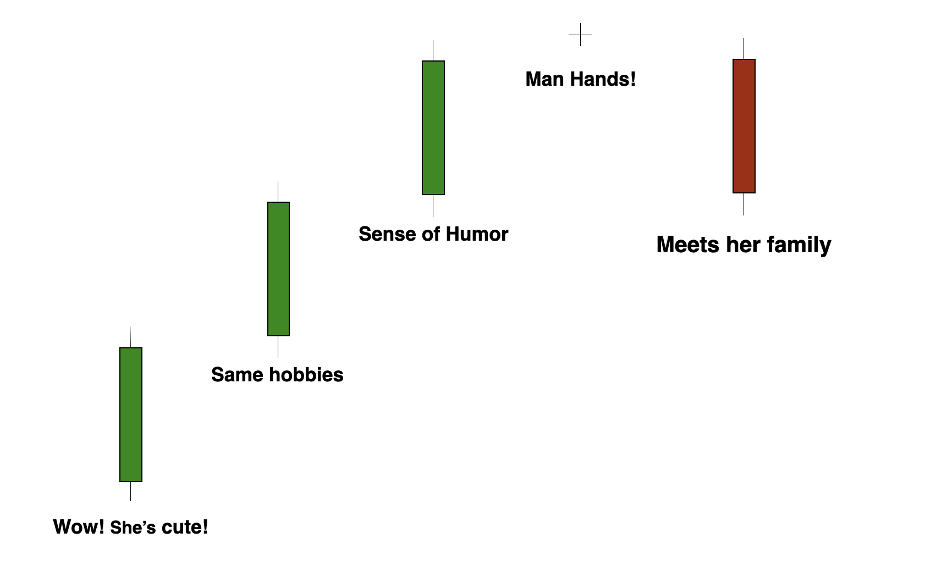
It goes something like this:
- Jerry meets a girl, he says wow she's cute
- He realizes the girl and him have the same interests and hobbies
- Even better, she has a great sense of humor
- Then something happens to change his mind and he’s not that excited anymore—such as having man hands—but he’s not sure if he’s ready to dump her
- Then he meets her family and it’s over
In the stock market, we can see the same kind of story play out over time. The market is infatuated with a stock and it keeps going up. Things are looking good. Then something happens where the market isn’t so sure anymore. It’s not going up, but it’s not going down either. Then the market turns and they just aren’t in love with the stock anymore. As a result the price starts to go down. Each moment in the story is told through the candlestick charts, and if you get good at reading the story, you can get great at building strategies to take advantage of where you’re at in the story.
Candlesticks are not guarantees…they are just indicators
Remember, these candlestick patterns are not guarantees, but they can provide valuable insights into market sentiment and potential trend reversals. It's important to use them in conjunction with other technical analysis tools and confirmation signals before making any trading decisions.
Original publish date:
September 06, 2023