Blog | Paper Assets
Negative Liquidity to Push Stocks Lower
February 01, 2016
Negative Liquidity To Push Stocks Lower
As regular readers of this blog know, I believe that credit growth drives economic growth, that liquidity determines which way asset prices move and that the government attempts to control both credit growth and liquidity to make sure that the economy doesn't implode. Therefore, I closely track and forecast credit growth and liquidity to anticipate future developments in the economy and the financial markets.
What I have found is that when credit (adjusted for inflation) grows by less than 2%, the United States goes into recession. At least that was true between 1952 and 2009. After 2009, credit has grown by less than 2% a year, but the Fed has managed to make the economy grow by printing money (Quantitative Easing) and pushing up asset prices to create a Wealth Effect that fuels consumption and growth. As 2016 gets started, credit growth is too weak to drive the economy (i.e. it's less than 2%) and there is no QE. So, it is not surprising that the US economy is once again weakening very rapidly.
To measure Liquidity, I have developed a Liquidity Gauge. When there is excess liquidity then asset prices tend to rise; and when there is a contraction of liquidity then asset prices tend to fall. During the third round of Quantitative Easing, there was a great deal of excess liquidity. At the peak of QE 3 in 2013, the Fed printed more than $1 trillion and pumped it into the financial markets. That year the stock market rose by 30%. During 2014, the Fed "only" printed and pumped $500 billion. That year, the stock market rose 11%. During 2015, there was no QE and the stock market did not increase at all.
Quantitative Easing is only one of the components used to calculate the Liquidity Gauge. The other two are Net Government Borrowing and the US Current Account Deficit. Here's the formula:
· When Net Government Borrowing is less than the Current Account Deficit plus Quantitative Easing, then there is Excess Liquidity. Then asset prices tend to go up.
· When Net Government Borrowing is greater than the Current Account Deficit plus Quantitative Easing, then there is a Contraction of Liquidity. Then asset prices tend to go down.
The Liquidity Gauge can be calculated on a quarterly basis or an annual basis. Over the last few days I have updated the Liquidity Gauge to incorporate the most recent historical data and to incorporate revisions to estimates about the size of Government Borrowing and the Current Account Deficit for the years ahead.
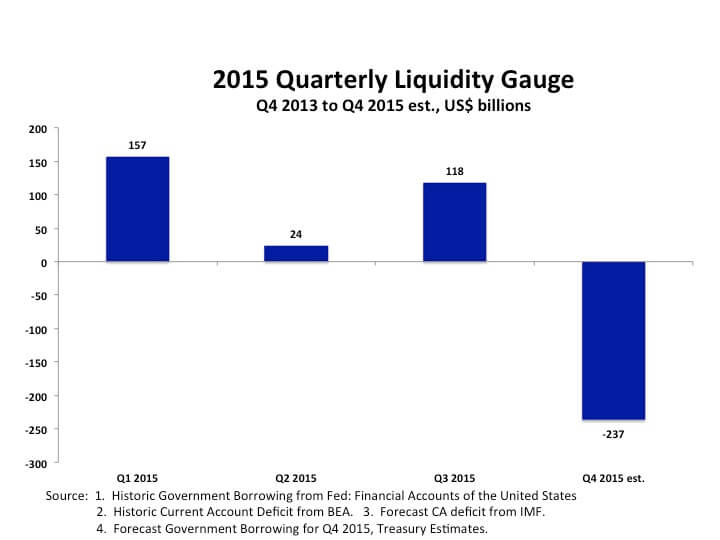
What I found is that Liquidity turned negative in the fourth quarter of 2015, as shown in the following chart.

I believe that contraction of Liquidity played an important role in the severe stock market selloff that began around that time.
If this is correct, the outlook for stocks and other asset prices is disturbing because (based on my projections for Government Borrowing and the Current Account Deficit) the Liquidity Gauge now indicates that Liquidity will remain negative FOR THE NEXT FIVE YEARS. That will create a much more difficult environment for asset prices.
Years of excess Liquidity have driven stocks, property, Net Worth and the economy higher. Those days are gone. As liquidity now contracts, asset prices are likely to fall, pulling the economy back into recession.
With credit growth weak and liquidity contracting, only a very steep drop in US government bond yields seems capable of keeping stock prices and the economy afloat. Therefore, investors should not be surprised if the Fed soon acts to drive bond yields lower - either through QE 4 or by threatening to impose negative interest rates on bank reserves. The Fed has been driving the economy by pushing up asset prices since 2008. They won't sit idly by if asset prices now continue to plunge.
Freedom Through Stock Investing
If you’re new to investing in the stock market, take advantage of Andy Tanner’s FREE introductory webinar.

Watch the Free Webinar
If you would like to learn more about the Liquidity Gauge, in particular, or about the crisis in the global economy, more generally, click on the following link to subscribe to my video-newsletter, Macro Watch:
http://www.richardduncaneconomics.com/product/macro-watch/
For a 50% subscription discount worth US$250 , hit the "Sign Up Now" tab (ignore the "$500 / year") and, when prompted, use the coupon code: richdad
You will find more than 21 hours of Macro Watch videos available to watch immediately. A new video will be added approximately every two weeks.
Original publish date:
February 01, 2016